Food and drink trends can be a fun time capsule to look back on. Between cronuts, all things unicorn-inspired, and cicada ice cream (seriously), foodie whimsy can take hold of the zeitgeist with a fiery grip.
You might see crazy headlines about different food trends or talk about them at the water cooler; we at Pan Galactic are curious enough to examine the numbers behind the latest phenomenon that is foodie fare. As a data-driven digital agency, we want the hard evidence that says something is, in fact, a big deal.
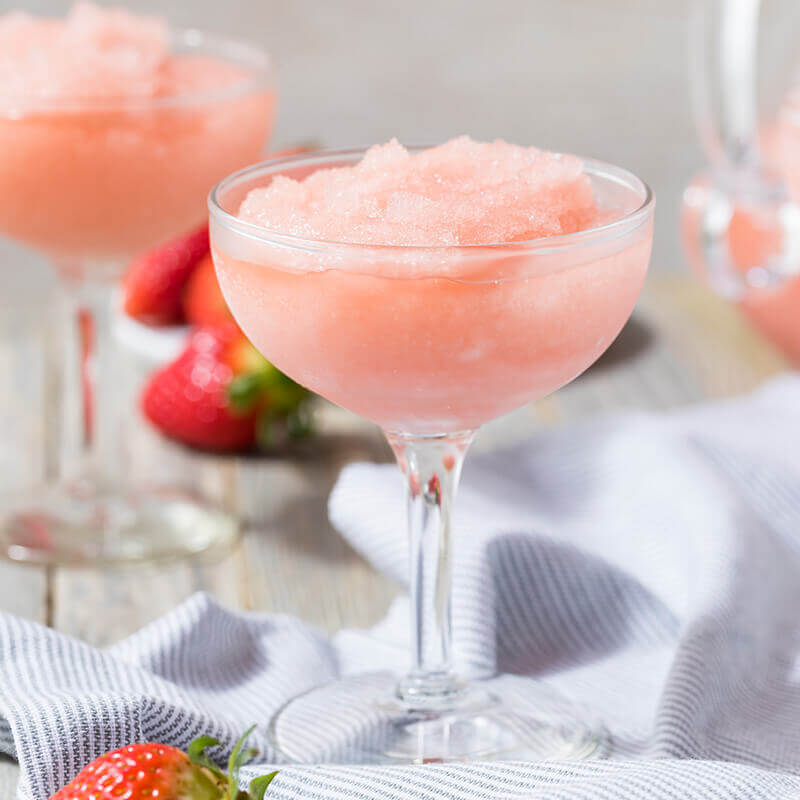
Saturday, June 9, is National Rosé Day; in order to celebrate the day best we know how, we decided to celebrate with and pay homage to frosé, which is a frozen rosé wine slushie. Specifically, we studied the rise of frosé’s digital footprint to determine how users have searched and interacted with frosé content since the beverage’s debut. With these numbers in hand, we considered a potential content strategy around the drink that knows how to get the party started. So blend a batch of your favorite frosé creation, and sit, sip and see how data provides great insight into determining what content about frosé would be best to develop in order to get the best return for a brand.
Once you have a topic in mind, determine if it’s worth writing about
Our first step was to determine whether anyone outside of our own immediate social circles was even talking about frosé. If we couldn’t find data that showed people were seeking information about our topic, we wouldn’t want to pursue it from a content strategy perspective.
Google Trends can be a great place to start when it comes to determining topic popularity. It’s a quick way to gauge topic interest, and it’s helpful if you don’t have access to subscription-based keyword tools. Note that the tool shows relative popularity of a given phrase rather than absolute search volume, so it’s trickier to find value in it if your keyword topic is more niche; those topics might not have enough data in Google Trends to give you much actionable information.
We first looked at the trend of people searching for the keyword “frosé” over the past five years in the United States. The term started gaining speed in 2016; as expected, there were noticeable spikes in the summer months, and searches bottomed out in the winter.
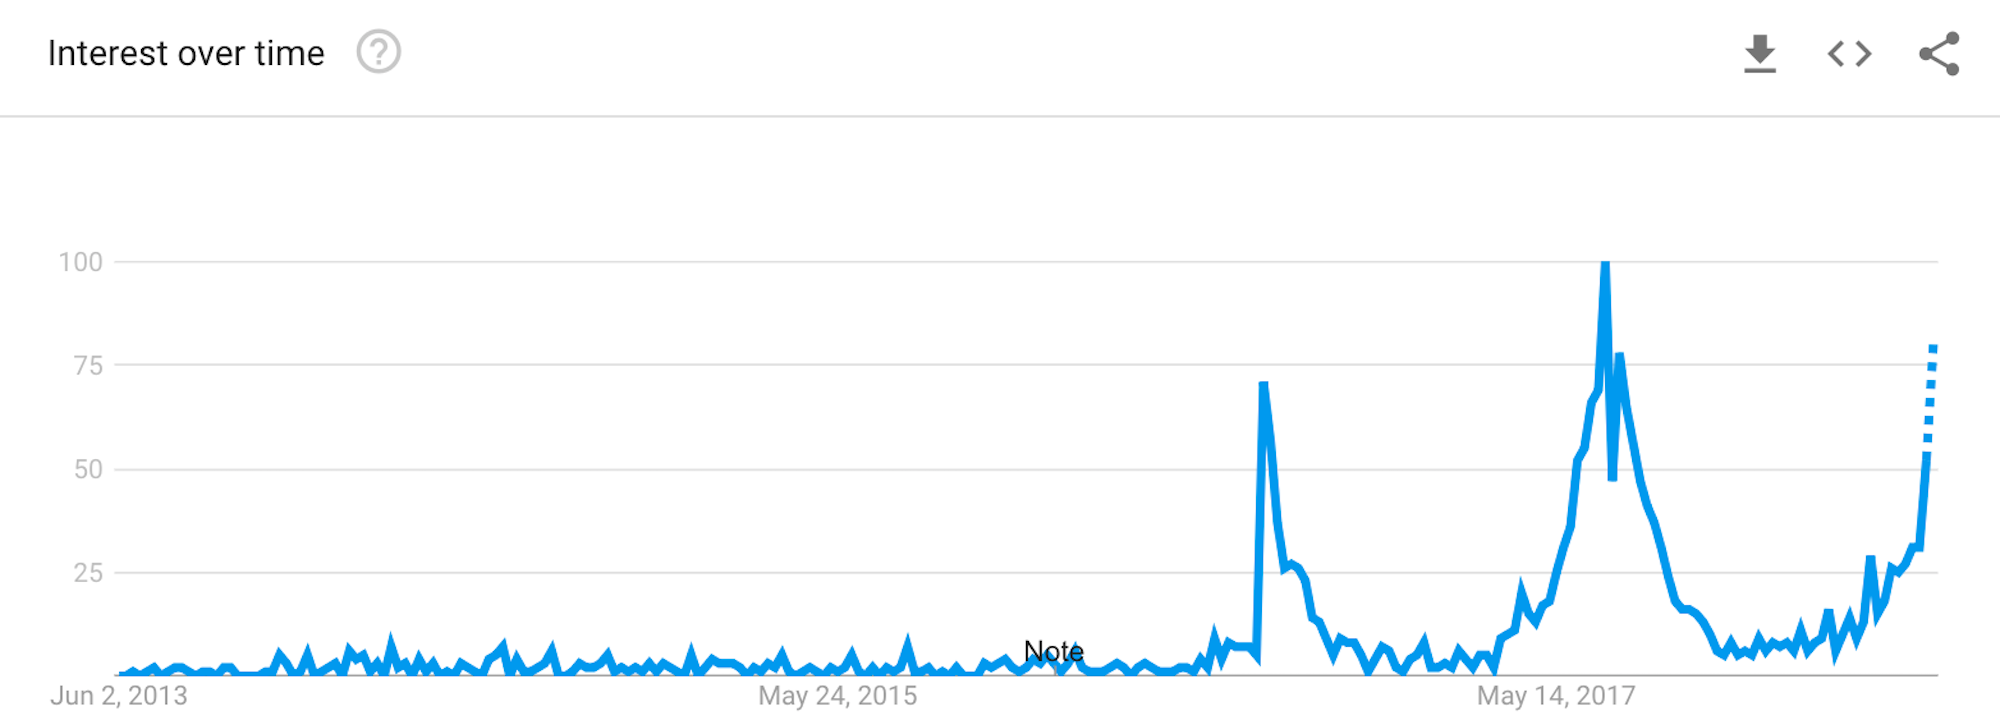
We had two key takeaways from this data:
- People are searching for frosé as a general content topic, so we felt confident digging further into the numbers behind frosé
- The beginning of summer would be a strategic time to launch a piece of content about this boozy bevy.
Determine where people are searching, especially for trendier topics.
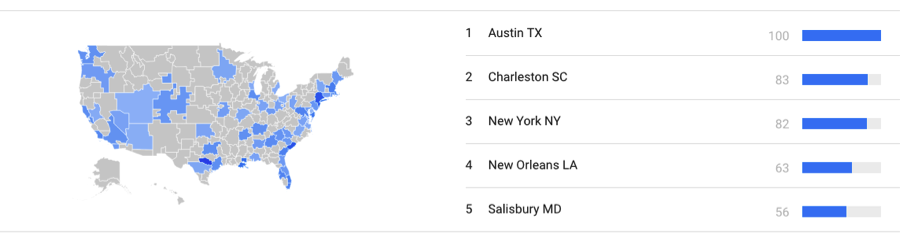
Next, we wanted to see geographically from where people are searching for frosé; Google Trends could tell us this too.
We first drilled down to see the states searching the most for frosé.

Curiosity about frosé is strongest on the East Coast, in New York and D.C. especially; this isn’t especially noteworthy for a food trend, so we decided to drill down one step further to look at frose interest in different cities. Austinites especially like a refreshing glass of the good stuff, and Charleston dwellers aren’t too far behind.
With this idea of whom we should target, we had a better idea of how to write the content and how to distribute the content. A Facebook ad targeting Sixth Street would probably do better than a Facebook ad targeting the Twin Cities.
How many people are searching for the topic?
Google Trends shows you relative popularity of a topic, but how many people are actually searching for it?
There are all sorts of keyword tools you can use to gain more insights into a topic’s keywords. Some industry favorites include Moz, SEMRush, or Ahrefs. All give essentially the same data, but each has its own database. Google’s Keyword Planner can also give some data, but because it’s geared toward PPC, we take it as more directional data for content development research.
Taking a look at keyword volume, one of the metrics available in a keyword tool, we could see just how often people search for frosé. The average monthly volume for the keyword “frosé” is about 9,900. That means that each month, users across Google in the United States google the word, frosé, about 9,900 times (this metric is calculated as a monthly average over the past 12 months).
For context, take a look at how this number compares to other warm-weather happy hour favorites:
- Mojito: 201,000
- Mimosa: 165,000
- Pina Colada: 110,000
- White Sangria: 14,800
- Frosé: 9,900
- Vodka soda: 8,100
- Canned Wine: 6,600

We can see it’s on the lower end of this spectrum, which falls in line with what we saw in Google Trends: it’s a newer trend with a seasonal trend line.
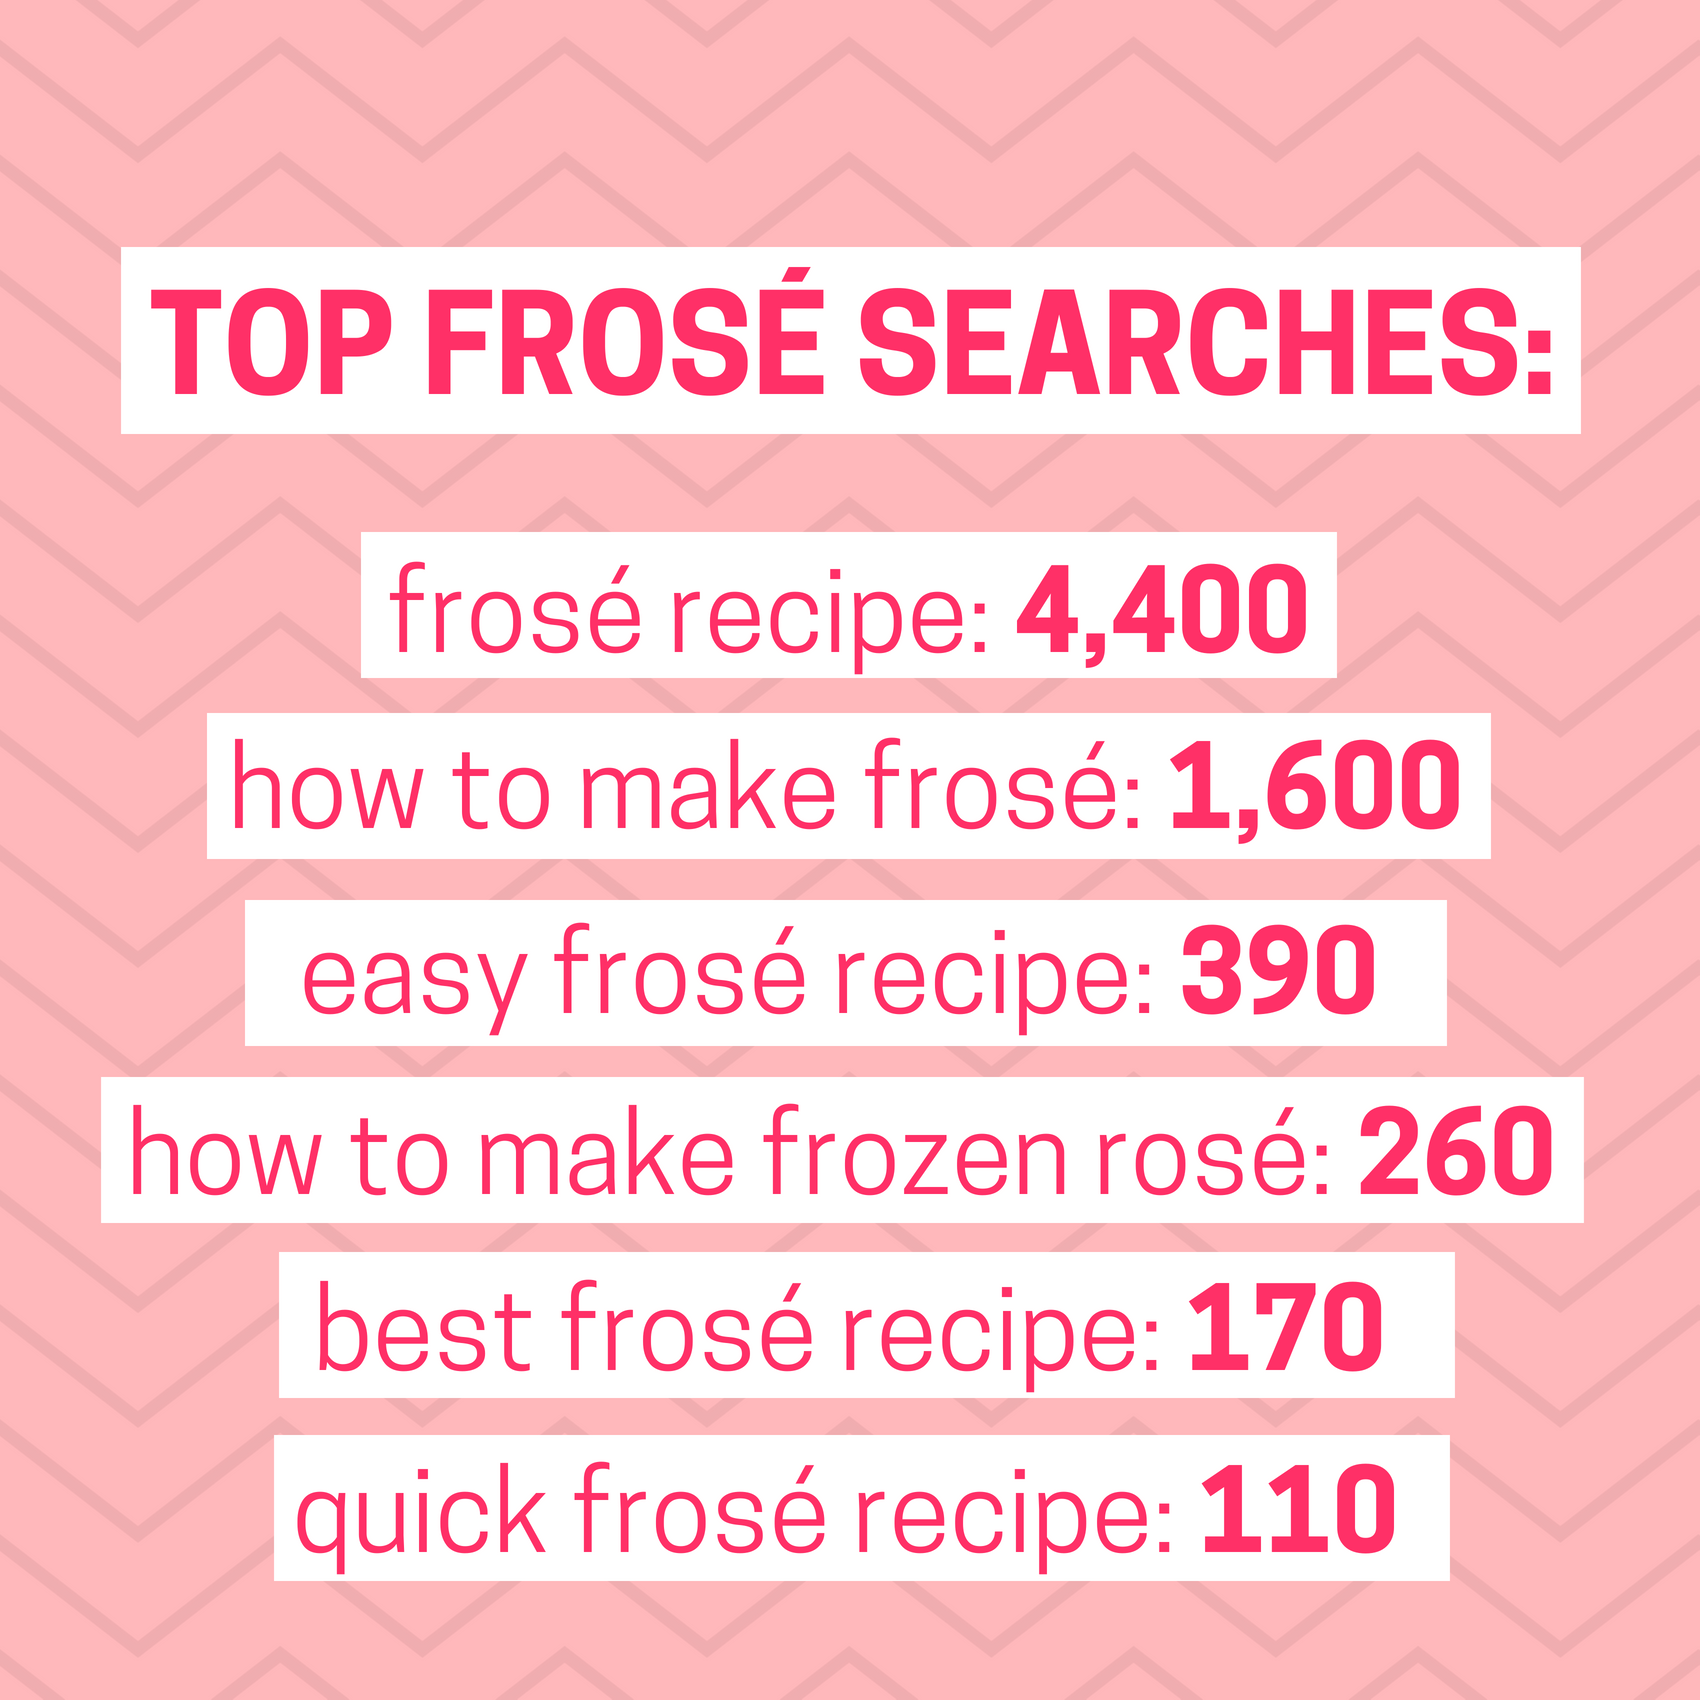
Furthermore, we took a look at what people were searching for related to “frosé.” What we found is that people are mostly curious to learn more about how to make frosé.
- Frosé recipe: 4,400
- How to make frosé: 1,600
- Easy frosé recipe: 390
- How to make frozen rosé: 260
- Best frosé recipe: 170
- Quick frosé recipe: 110
Slowly but surely, a frosé story was starting to form from this data. At this point, we knew that there is search interest and that this search interest follows a seasonal trend. More people search for frosé along the East Coast, especially in the South, and searchers are interested in learning how to make it.
How competitive is the content topic?
As a next step, we examined just how competitive the keyword itself is. When you are determining content for your brand to create and for which to rank well, keyword difficulty is a crucial step to consider. If you can’t rank on the first page of Google for your keyword topic within six months to a year, it might not be the best time to pursue it. (After all, the best place to hide a dead body is the second page of Google!)
There are three components you need to consider when it comes to a keyword’s difficulty:
- Domains ranking for the keyword topic
- The actual content that is ranking
- The SERP landscape

How strong are the domains that are already ranking on the first page?
Domain strength is critical because Google considers website strength when it determines which content to rank in the order that it does. If a keyword phrase’s first three results are Wikipedia, The New York Times, and Amazon, we know that keyword is competitive. These three sites are incredibly strong—they have been around for a long time and have plenty of external links pointing to them—so outranking them will be a challenge. When you consider keyword difficulty, your domain’s strength will determine the degree of difficulty you should pursue in your keywords.
The top three results for the broad keyword “frosé” are Bon Appetit magazine, Iowa Girl Eats, which is a food blog, and Real Simple magazine. These sites are all strong, so if our domain isn’t as strong, we would want to drill down to a more specific keyword idea.
How strong is the content that is already ranking?
When figuring out a keyword’s difficulty, you also want to look at the content that is already ranking, again paying attention to the quality and quantity of links pointing to it.
At the time of publication, the first organic result for “frosé” had 519 links pointing to it from 224 domains; the second result has 467 links from 16 domains; and the third result had 109 links from 52 root domains. Google ranks its results based on a multitude of factors, and a backlink profile is a crucial one. We knew that our content piece had to acquire a healthy number of links in order to compete with these sites that are already visible in these prime real search positions.
How competitive is the SERP itself?
You also want to analyze the competitiveness of the search engine result page (SERP) for the keyword you are looking at. Years ago, Google would display 10 blue links on each results page, and all 10 links would be organic results. Times have changed in a big way. Now there are all sorts of SERP features that compete with organic rankings. PPC ads, knowledge graphs, instant answers, and more can push the first organic result further down the page and decrease that SERP’s overall CTR.
Here is the SERP for “frosé.”
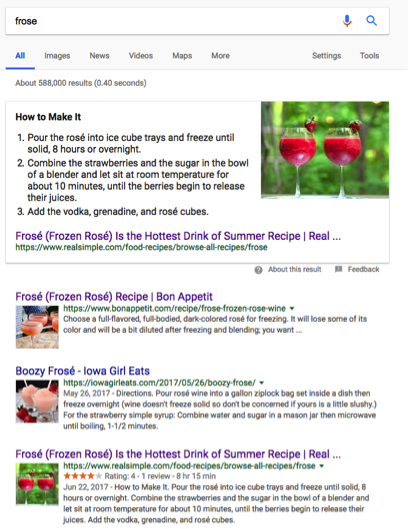
Consider this: For the keyword “frosé,” the number of searches that result in clicks is about 40%. That means that roughly 6 in 10 people will Google “frosé” and not click a single link on the page. Looking at frosé’s SERP result, this makes sense; the answer box at the top, called a featured snippet, clearly gives away the recipe without requiring a click.
Trying to win featured snippets for your brand is a sound digital strategy that should be pursued as more featured snippets pop up across searches. If our brand doesn’t think it can win the featured snippet, this keyword might not be worth our time because only about 40% of searchers click on a result to begin with.
Now we know that frosé is a pretty competitive keyword to pursue on its own; we will want our final content idea to be more targeted and more long-tail so that it has a better-defined intent in order to help it stand about among the competition, ideally high up in the SERPs. After all, visibility is what we are after; if it isn’t visible on Google, we don’t want to pursue the topic idea.
What other similar content has been popular and shared?
Armed with this knowledge about the keyword, frosé, we next want to see the content about frosé that has been shared the most number of times. This gives us more clues about the content that people have liked and shared about frosé.
There are a few tools that aggregate the number of social shares for content related to whatever topics you are searching for. We like Ahrefs and Buzzsumo.
When we looked to see which frosé content has been shared the most, we saw what we expected: mostly recipes.
At this point, we were curious to see where online people were sharing frosé content. Frosé is such a visual topic, so we were validated in our suspicions that Pinterest would be the main social driver for this content. We made a note that any frosé content we create will need to have strong visuals in order to catch the eye in Pinterest’s visual search engine.
We also researched if anyone had created content about frosé that was more unique than a simple recipe. Turns out, they had! One of the most shared content pieces discusses how to make frosé without a blender at the beach; this was a fun take on the topic, showing how it can be made more convenient. This suggested that our content could have some sort of twist to it rather than a straightforward recipe.
How to determine what your content should be based on the data you have uncovered
At last we had gathered all of our data and insights.
People are talking about frosé, especially how to make it. Southerners have a sweet spot for the sweet stuff, and while the drink doesn’t have the search volume that more traditional drinks have, there is still plenty of volume to make creating content worth our time.
The frosé search space is competitive, so we will want to target a longer-tail keyword. We know our content needs to be highly visual in order to increase the odds of it being shared, and it should be a smart take on a recipe so that we can offer something unique.
With this knowledge, we now know what we want to write about, how to write about it, and our thoughts are backed by the data. We have hard numbers that show why we think this content will be effective. Now we are ready to create, publish, and optimize.
A content strategy backed by data is a must in today’s digital environment. With so much data available to marketers today, we would be remiss to not use it to our advantage when deciding how to strategically create content. By looking at a topic’s search trend, keyword data, and most shared content, we can determine how we can best add our voices to the conversation.
Like what you’ve read? Sign up for Pan Galactic Digital’s monthly newsletter, The Mothership, for more analysis and know-how.